
Short Courses
- Scale Invariance of Dolomite Structure: From SEM to Seismic through Digital Twins and Turing Patterns
- Multifractals in geophysics and geology
- Data-Driven Methods for Spatial (primarily) and Spatiotemporal Regression - canceled
- Quantitative Causality Analysis with Information Flow: A Tool for Data-Driven Discovery in Earth and Geosciences - canceled
- Density data analysis for big data processing in geosciences - canceled
- Scale Invariance of Dolomite Structure: From SEM to Seismic through Digital Twins and Turing Patterns
- Multifractals in geophysics and geology
Data-Driven Methods for Spatial (primarily) and Spatiotemporal Regression↑
Canceled
- organized by: Dionissios T. Hristopulos, Technical University of Crete, Greece
- Venue: coming soon
- Date: October 09
- Time: coming soon
- Min. number of participants: 5
- Max. number of participants: 15
- costs per participant: US$ 50/RMB 350
- Attendance Requirements: -
- Recommended prerequisites: Knowledge of probability and statistics.
General course description
This one-day course will focus on probabilistic spatial regression methods. Such methods help to determine relations between spatially distributed variables and exploit them for spatial prediction. The focus will be on data-driven methods of regression in which the underlying relations are primarily inferred from the data (i.e., without assuming underlying parametric models). More precisely, we are going to discuss covariance-based methods such as kriging and Gaussian process regression (GPR) as well as the covariance-free method of stochastic local interactions (SLI) which employs the precision (interaction) matrix. The course will include introductory-level topics in spatial statistics and Gaussian processes as well as some more advanced topics.
Course objectives and learning outcomes
To gain familiarity with data-driven spatial regression methods. To develop an understanding of fundamental theoretical concepts such as the covariance kernel, the variogram function, stationarity, precision matrix, cross-validation, prediction and uncertainty quantification. To familiarize with the “zoo” of covariance kernels and their properties. To become acquainted with model estimation methods such as variogram fitting and maximum likelihood. To understand the principles of kriging, GPR and SLI and the computational requirements of each method. To highlight connections between geostatistics and machine learning methods of spatial regression. To develop the ability to use the data-driven regression methods in practical studies.
Course content
Spatial model for regression, Trend Models, Kernel Smoothing. Positive-definite functions (covariance kernels), Isotropy and types of anisotropy, variogram function Model Estimation (variogram fitting and maximum likelihood) Spatial Prediction with Kriging, uncertainty estimates, computational requirements Introduction of Gaussian process regression and relation to geostatistical framework The precision (interaction) matrix and Stochastic local interaction models Warped Gaussian processes and nonlinear regression What are the complications in the case of spatiotemporal datasets? Examples
Quantitative Causality Analysis with Information Flow: A Tool for Data-Driven Discovery in Earth and Geosciences↑
Canceled
- organized by: X. San Liang, Dept. of Atmosphere-Ocean Science, Fudan University, Shanghai, China; ivision of Frontier Research, Southern Marine Laboratory, Zhuhai, China; School of Artificial Intelligence, Sun Yat-Sen University, Zhuhai, China
- Venue: coming soon
- Date: October 09
- Time: coming soon
- Min. number of participants:10
- Max. number of participants: unlimited
- costs per participant: US$ 50/RMB 350
- Attendance Requirements: Familiar with a programming language such as Matlab, Python, R, and should have it installed on their laptops.
- Recommended prerequisites: -
Summary
Data-based causality analysis is a great help for scientific discovery. In this half-day course, we will introduce, in an easy way, a recently developed quantitative causality analysis, which has been widely applied in different disciplines, Earth and geosciences in particular, with interesting discoveries which would otherwise be difficult, if not impossible, to discover. We will take you for a brief stroll through the theory, with more emphasis on real applications. There also will be a lab lesson for you to gain hands-on experience in using the provided software. Causality analysis is an important and old problem lying at the heart of scientific research. Causality analysis based on data, however, is a relatively recent development. Traditionally causal inference has been classified as a field in statistics. Motivated by the predictability problem in physical science, it is found that causality in terms of information flow/transfer is actually a real notion in physics that can be derived ab initio, rather than axiomatically proposed as an ansatz, and, moreover, can be quantified. A comprehensive study with generic systems (both deterministic and stochastic) has just been fulfilled, with explicit formulas attained in closed form (Liang, 2016). In the linear limit, its maximum likelihood estimator is concise in form, involving only the commonly used statistics, i.e., sample covariances. An immediate corollary is that causation implies correlation, but the converse does not hold, expressing the long standing philosophical debate ever since Berkeley (1710) in a transparent mathematical expression. The above rigorous formalism has been validated with benchmark systems like baker transformation, Hénon map, stochastic gradient system, and with causal networks in extreme situations such as those buried in heavy noises and those with nodes almost synchronized (e.g., Liang, 2021), to name a few. They have also been applied to real world problems in the diverse disciplines such as climate science, meteorology, hydrology, turbulence, artificial intelligence, neuroscience, financial economics, quantum mechanics, etc.
Learning outcomes
- The participants will have a basic understanding of information flow (IF), a quantitative causality measure rigorously derived from first principles, and its properties such as invariance upon nonlinear transformation, capability of handling latent confounding, self-loop, etc.
- The participants will learn how to estimate IF from data, and use the resulting estimator to easily infer the causal relations, in a quantitative way, between two time series.
- The participants will also learn how to deal with the causal inference with panel data.
- The participants will be convinced of the easiness in making scientific discoveries through a variety of realistic applications.
- The participants will gain hands-on experience in using the software as provided.
Prerequisites and materials
- No coding experience required.
- Some basic knowledge of calculus and statistics.
- Familiar with one programming language such as Matlab, Python, R.
- All datasets will be provided, together with open source codes.
Density data analysis for big data processing in geosciences↑
Canceled
- organized by: Karel Hron, Palacky University Olomouc, Czech Republic (onsite); Alessandra Menafoglio, Politecnico di Milano, Italy
- Venue: coming soon
- Date: October 09
- Time: coming soon
- Min. number of participants: 5
- Max. number of participants: coming soon
- costs per participant: US$ 50/RMB 350
- Attendance Requirements: Attendees should bring their own laptops with R installed.
- Recommended prerequisites: Multivariate statistics, Introductory courses in algebra and calculus, Basic knowledge of R.
Course description
The analysis of distributional data (probability density functions or histogram data) has recently gained increasing attention in the geosciences due to the possibility of automated data collection. Distributional data, expressed as probability density functions, are often observed by themselves (particle size distributions) or as a result of aggregation of large data streams (e.g., distributions of concentration values). This course provides an introduction to Density Data Analysis (DDA) from the perspective of Bayes spaces using methods of functional data analysis. Bayes spaces are mathematical spaces whose points are densities, generalizing to the functional setting the Aitchison simplex for multivariate compositional data. The course will give a brief overview of the concise theory of Bayes spaces as well as statistical methods developed in this setting. All methods will be illustrated with examples from real case studies in the geosciences and beyond.
Course objectives and learning outcomes
The course aims to introduce attendees to the principles and basic methods of density data analysis, how to apply them with R and how to interpret the results obtained. The course combines theoretical classes with practical data analysis.
Content
- DDA and the geometry of Bayes spaces
- Exploratory DDA and dimensionality reduction
- Density-on-scalar, scalar-on-density and density-on-density functional regression
- Bivariate densities and their orthogonal decomposition
- Introduction to multivariate Bayes spaces
Free software
R Project for Statistical Computing: www.r-project.org
Scale Invariance of Dolomite Structure: From SEM to Seismic through Digital Twins and Turing Patterns↑
- organized by: Klaudia Oleschko, Centro de Geociencias, Universidad Nacional Autonoma de Mexico (UNAM)
- Venue: coming soon
- Date: October 09
- Time: coming soon
- Min. number of participants: 5
- Max. number of participants: coming soon
- costs per participant: US$ 50/RMB 350
- Attendance Requirements:
- Recommended prerequisites:
 Multidimensional, multisensor, multisource, multitemporal, multiprocess data
fusion, multiscale visualization, mapping, and management are pending tasks in
Geosciences. Notwithstanding, joint physics-informed interpretation of geophysical,
petrophysical, and geological Big Geo Data are crucial for innovation, sustainable
design, and management of industries, especially petroleum. Information gathering
may start on the field or the micro-/submicroscopic scales. The problem is that
many scientists still prefer to work on one or a significantly reduced scale range.
During the last ten years, new and original Technology has been designed in the
LAFSINA (Laboratory for Fractal Analisis of Natural Systems), Institute of
Geosciences. This Technology is based on the Nature-inspired Software "Muuk'il
Kaab," which was applied and calibrated in several strategic fields of PEMEX.
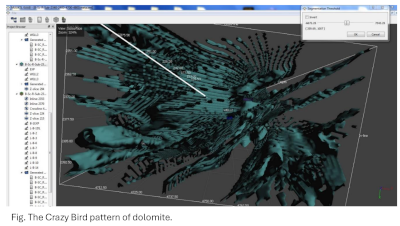
Carbonates and dolomite are the dominant rocks in the studied areas. During the
last six months, the design of the new MIK module for visualization of reaction-
diffusion multiscale patterns was finished and calibrated on the field. The apparent
statistical invariance of these patterns across the scale was documented for
dolomite oil source rocks. The first Library for Advanced Machine Learning of
carbonates and dolomites structure was designed.
Multidimensional, multisensor, multisource, multitemporal, multiprocess data
fusion, multiscale visualization, mapping, and management are pending tasks in
Geosciences. Notwithstanding, joint physics-informed interpretation of geophysical,
petrophysical, and geological Big Geo Data are crucial for innovation, sustainable
design, and management of industries, especially petroleum. Information gathering
may start on the field or the micro-/submicroscopic scales. The problem is that
many scientists still prefer to work on one or a significantly reduced scale range.
During the last ten years, new and original Technology has been designed in the
LAFSINA (Laboratory for Fractal Analisis of Natural Systems), Institute of
Geosciences. This Technology is based on the Nature-inspired Software "Muuk'il
Kaab," which was applied and calibrated in several strategic fields of PEMEX.
Carbonates and dolomite are the dominant rocks in the studied areas. During the
last six months, the design of the new MIK module for visualization of reaction-
diffusion multiscale patterns was finished and calibrated on the field. The apparent
statistical invariance of these patterns across the scale was documented for
dolomite oil source rocks. The first Library for Advanced Machine Learning of
carbonates and dolomites structure was designed.
Topics
This Short Course is a Practical Guide for Advanced Machine Learning and Data-driven modeling in Geosciences
- Architecture of Complexity versus Architecture of Training Algorithms and Models: which Transformers are the best?
- Scalable machine learning algorithms: from SEM to DEM through seismic by unifying machine learning and physical models;
- Attention versus Self-Attention in Machine Learning applied to Geosciences;
- Encoding Physics in Numbers. Which number system is more informative for Geoscientific research?
- Nature-inspired and Physics-informed Number Generators: example of Ising Machine;
- Decoding topological, geometrical, and associated features from original nonstructured and structured data: More is different in Geoscience;
- Nature-inspired and Physics-informed Machine Learning of the critical behavior of soft matter fluids in Porous Media: Earth Surfaces as a soft matter landscape;
- Big Data in Geosciences: toward the Digital Twins and Turing micro and macro patterns;
- Architecting Digital Twins for Intelligent Geosciences design: example of some oil fields of Mexico.
Multifractals in geophysics and geology↑
- organized by: Shaun Lovejoy, Physics, McGill University, Canada; Qiuming Cheng, Sun Yat-Sen University Zhuhai, China
- Venue: coming soon
- Date: October 09
- Time: coming soon
- Min. number of participants: 5
- Max. number of participants: coming soon
- costs per participant: US$ 50/RMB 350
- Attendance Requirements:
- Recommended prerequisites:
In this three hour course, we survey:
- The basic statistical properties of multifractal processes, in particular, their exponents that characterize the statistical moments and probability distributions.
- We discuss anisotropic scaling needed for realistic textures, geomorphologies.
- Extreme events (scaling in probability space).
- Numerical modelling (including fractional equations).
- How dynamical regimes are objectively defined by scaling (particularly the bio-geo megaclimate regime).
- Data analysis techniques, focusing on Haar fluctuation analysis.
- We give examples including plate tectonics, the climate, multifractal geochronologies and macro evolution.