

Short Courses
We are pleased to propose the following pre-conference short courses wich will happen on Monday, Aug 29. The short courses are planed to take part in person. However if the pandemic situation does not allow it, some courses may be delivered remotely (but not in hybrid mode). The final format will be decided for on a case-by-case basis depending on the registration status.
Please register early for the short courses at our web shop, as the number of attendees is limited:
http://www.iamgmembers.org/catalog/index.php?main_page=index&cPath=109_111If for some reason a short course happens to be canceled, the course registration fees will be refunded.
- Global envelopes in R
- 2D & 3D analysis of regional geoscience datasets with Loop open source libraries
- Introduction to geological model building with UVT Transform™ technology
Global envelopes in R↑
|
 |
 |
click here to get more information
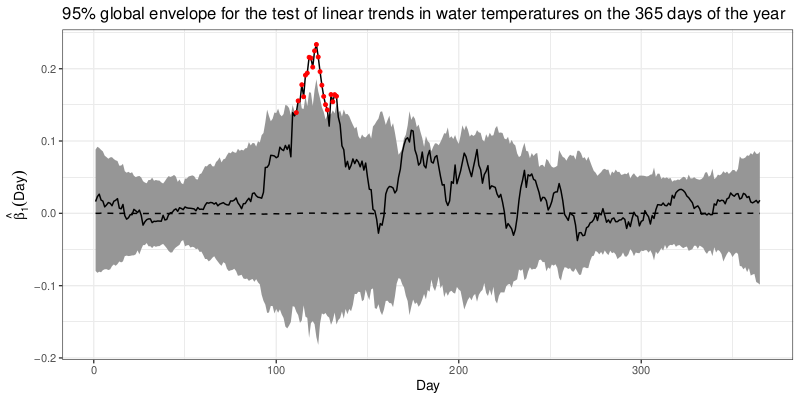
Traditionally, one-dimensional or multivariate test statistics have been used to test different hypotheses. Today the handling of the data is more rich, and we can have data that can provide more insight on the studied phenomena if a functional test statistic is used. But this can be quite challenging: one has to take care of the multiple testing problem and changes in the distribution across the domain; often the test statistic is a specific one so its distribution is not known; and often the user requires a graphical interpretation of the testing results so that the interpretation of results is more understandable. Therefore, we have developed a non-parametric method that is based on Monte Carlo simulations or permutations, which handles all the above challenges. The methodology is implemented in the freely available R (R Core Team, 2021) package GET (Myllymäki and Mrkvička, 2020; Myllymäki et al., 2017). The official release can be found in Comprehensive R Archive Network (CRAN) and its development version via a github repository:
- Official release: https://cran.r-project.org/package=GET
- Development version: https://github.com/myllym/GET
We introduced the methodology first for a general Monte Carlo test with any functional test statistic in the case where the functions are simulated under the null model (Myllymäki et al., 2017). We have further considered and developed the methodology for general multiple Monte Carlo testing (Mrkvička et al., 2017), functional ANOVA (Mrkvička et al., 2020) and general linear models (Mrkvička et al., 2021; Mrkvička et al., 2021), functional outlier detection and clustering (Dai et al., 2020b,a). The methods have already shown their usefulness in many areas, e.g., spatial statistics (Myllymäki et al., 2017; Mrkvička et al., 2017; Mrkvička et al., 2016; Myllymäki et al., 2020), functional data analysis (Narisetty and Nair, 2016; Mrkvička et al., 2020; Mrkvička et al., 2021; Mrkvička et al., 2021; Racine et al., 2021) and image analysis (Mrkvička et al., 2021) with applications to agriculture, architecture and art, astronomy and astrophysics, ecology and evolution, economics, eye movement research, fisheries, forestry, geography, material science, and medicine, health and neurosciences (see Myllymäki and Mrkvička, 2020, and references therein). We believe that the methods can be helpful also in future applications in Earth and geosciences. Therefore, this short course is proposed to share the knowledge about these methods and the package to the IAMG community.
Learning Outcomes
- The participants will have basic understanding of a Monte Carlo and permutation test based on a single, multivariate and functional test statistic. They know the basic principles of running a global envelope test in R, and have tested it in example situations.
- The participants are aware that the global envelope is a general tool that can be used also for other purposes than testing such as central regions of functional data, and confidence and prediction bands.
Prerequisites
We expect the participants have some basic knowledge/understanding of statistics and the R software. The course is not intended to discuss very basics of the R code itself (such things as x <- 1 means that the value 1 is set to the object named as x). Also the participants should have the newest version of R (https://cran.r-project.org/), and preferably also Rstudio (https://www.rstudio.com/), installed on their computers, if they want to test things themselves. They could additionally also install the GET library in advance by starting R and typing install.packages(’GET’) there.
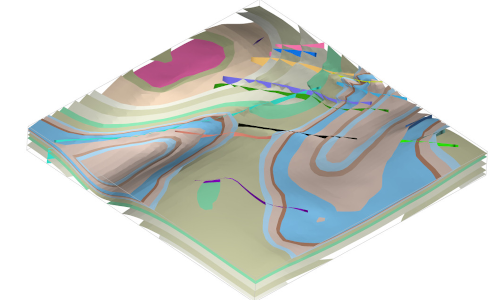
2D & 3D analysis of regional geoscience datasets with Loop open source libraries↑
|
 |
 |
click here to get more information
Learning outcomes
Prerequisites and materials
|
 |
Time Table
Morning session: Getting your data faster, getting more from your data
This session will focus on methods to automatically extract geological, petrophysical and geophysical information from geosurvey datasets for use map analysis, geophysical inversion and 3D geological modelling.
-
Exercise 1. 2D map analytics
In this exercise we will select a geological region of interest and automatically compile a series of graphics that help us to understand the spatial and temporal relationships of the different geological elements. This includes space time plots, local stratigraphic analysis, fault offset analysis, and the calculation of 2D proximity maps to help us understand the spatial relationship between different geological features in the area. -
Exercise 2. Automated 3D geological modelling
By building on the analysis in part 1 of the workshop, we are able to convert the available geological data into the inputs required to feed the LoopStructural modelling engine and build a 3D geological model of the area. -
Exercise 3. Geophysical inversion
In this exercise we will extract a 2D profile from the region of our geological model and compare that with the available density, magnetic susceptibility, gravity and magnetic data to better constrain our profile via geophysical inversions using the tomofast-x codes.
Afternoon session: Implicit 3D modelling using LoopStructural
This session will focus on using the implicit modelling library LoopStructural and demonstrate the various algorithms that can be used for implicit 3D modelling. This session will follow on from the previous session and provide the participants a better understanding of how the 3D modelling code works and the required input dataset.
-
Exercise 1. From map to model
In this example we will use a geological map from the morning session and manually build an input dataset for LoopStructural. This will demonstrate what the input datasets for the implicit algorithm. We will explore the sensitivity of the model to different aspects of the interpretation. -
Exercise 2. Building a model of a folded series using the fold interpolator
In this exercise we will use the fold interpolation algorithms to build a model of a synthetic cylindrical fold and explore the s-plot for analysing fold geometries. A more complicated example using non-cylindrical refolded folds. -
Exercise 3. Comparing interpolators
In this exercise we will compare using direct interpolation using radial basis functions with the discrete interpolation. The scalar field will be interpolated as a signed distance field using the cumulative unit thickness for the scalar value or using the increment method where the value of the scalar field is unknown. This example will also provide the optional opportunity to build a custom python function for comparing model results.
Introduction to geological model building with UVT Transform™ technology↑
|
 |
 |
click here to get more information
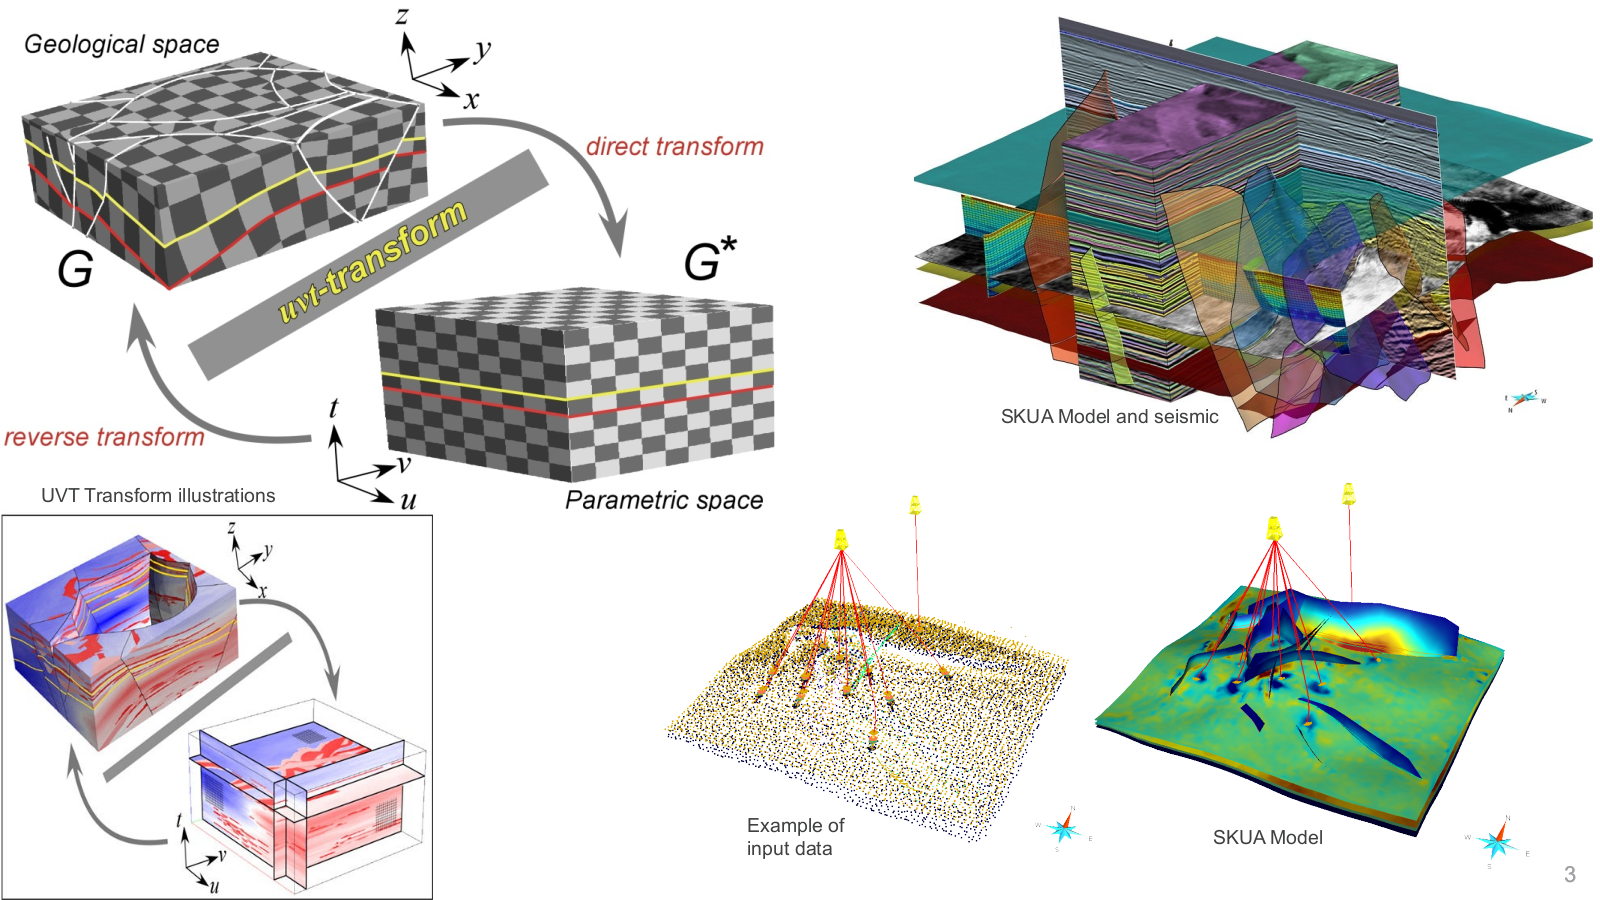
SKUA-GOCAD is a complete geomodelling application used to incorporate any kind of geologic
structures – including for instance multi-z surfaces such as salt dome, and complex faults
network with overthrust and reverse faults- to provide high-definition reservoir models
thanks to the unique UVT Transform™ technology.
UVT Transform™ technology is a volumetric approach that completely redefines modeling
mechanics, reducing modeling time and improving ease of use. It enables higher accuracy and
a geologically consistent representation of the subsurface.
The aim of this session is to present how to quickly build a structural and stratigraphic model
for reservoir modeling purposes through simple-to-use workflow-based interface users.
For this purpose, the participants will attend a 1-day session divided into three chapters.
Users will be invited to practice building a 3D geological model from interpretations and
generating an optimal 3D Grid for accurate geostatistics.
This session will also include a short presentation of enabled possibility provided by UVT
Transform™ technology and included in SKUA-GOCAD including fault seal analysis, hybrid
grid, tetrahedral mesh for geomechanics, paleo-flattening, geologically-consistent velocity
modeling.
Time Table
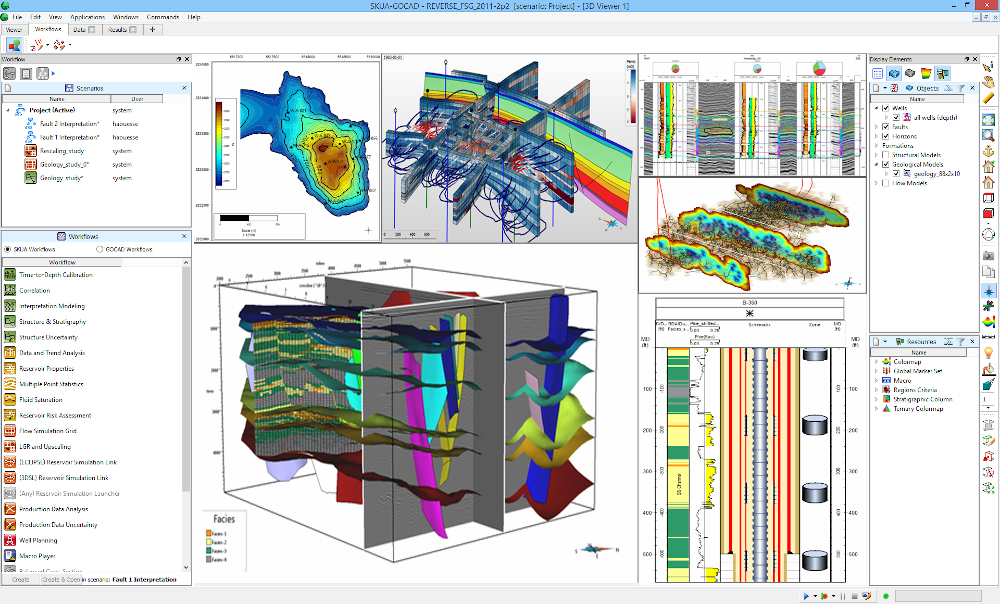
Chapter #1: Introduction to SKUA-GOCAD
In a user-friendly environment, SKUA Structure and Stratigraphy workflow provides
automatic construction of a fully sealed 3D geological framework.
An overview of the modeling process and the specificities of SKUA-GOCAD technology to
generate accurate reservoir models will be covered in this first chapter.
Exercise: Users are invited to getting familiar with the application to learn how to navigate
through the interface and multiple viewers in SKUA-GOCAD environment.
Chapter #2: Data Preparation
SKUA approach allows to reconcile all available data - including users geological knowledge
along with well and seismic interpretation data. For this reason, preparing the data is a crucial
step and consists of defining the stratigraphic and structural context of the model and sorting
numerical data by its geologic meaning.
Exercise: Through a series of exercise, attendees will learn about geologic features,
stratigraphic column and well stratigraphy, as well as their impact on the 3D geological
framework.
Chapter #3: Structure and Stratigraphy Modeling
Finally, within Structure and Stratigraphy workflow, attendees will build step-by-step their
structural model to represent the key subsurface elements of the reservoir (faults and
horizons) and from this structural model, the participants will build a geologic grid.
Exercise: The process is divided in several sequences: specify the input data and define the
Volume of Interest determining the 3D extension of the model. Build the fault network and
define contacts between faults. Build the horizons and then, generate the 3DGrid. Each step
is preceded by a demonstration and attendees will then be invited to practice in an interactive
environment.
IAMG2022 sponsored by: